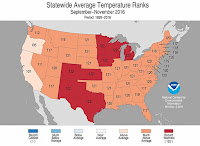
The autumn of 2016 was the warmest ever observed in records going back to 1895 for the 48 contiguous U.S. states, according to data released on Wednesday by NOAA’s National Centers for Environmental Information (NCEI). The nation’s average September-to-November temperature of 57.63°F was a full 1.05°F above the previous autumn record, set way back in 1963, and it was 4.08°F above the 20th-century average (see Figure 1). The record-setting margin of more than 1°F is a hefty one for a temperature record that spans an entire season and a landmass as large as the 48 contiguous states. For comparison, the second, third, fourth, fifth, sixth, and seventh-warmest U.S. autumns are all clustered within 1°F of each other, as are the six coldest autumns on record.
Pushing this past autumn to the top of the temperature pack were the third-warmest October and third-warmest November on record, along with the ninth-warmest September. Eight states along a swath from New Mexico to Michigan saw their warmest autumn on record, and every contiguous state except for California, Nevada, Oregon, and Washington had a top-ten warmest autumn (see Figure 2).
Record highs outpace record lows in November by an unprecedented margin
Although it wasn’t the warmest November on record, last month transcended all other months in modern U.S. weather history by the outsized presence of record highs to record lows. According to preliminary NOAA data compiled through Wednesday, November saw 4544 daily record highs set or tied, and just 94 daily record lows set or tied--a ratio of more than 48 to 1! This is the largest such ratio for any month in U.S. data going back to the 1920s, according to independent meteorologist Guy Walton (@climateguyw), who has tracked U.S. records for many years. Because many U.S. reporting stations came on line in the 1890s, the occurrence of records did not stabilize until around the 1920s.
The total of 94 daily record lows in November is remarkably sparse--the lowest value for any month since September 1922. In general, it’s best to use warm-to-cold ratios rather than comparing the raw number of records over time, observed Deke Arndt, the chief of NOAA/NCEI’s Climate Monitoring Branch. “Because the number and lifetimes of weather stations has varied over time, comparing raw numbers of records doesn't completely capture the signal. Using a ratio of warm-to-cold records helps account for these effects,” Arndt told Mashable’s Andrew Freedman. Each decade since the 1980s has seen more daily record highs than lows, with the ratio increasing to nearly two-to-one during the 2000s and just over two-to-one for the 2010s through November 2016.
Read more at Autumn 2016: Warmest in U.S. Weather History


No comments:
Post a Comment